

Pingdom Integration: Synthetic Checks to Incido Incidents
When Pingdom marks a check DOWN, Incido receives the webhook on a Pingdom-type monitor and can open an incident, often the first outside-in signal that customers are affected.
Ideal for teams that already trust synthetic monitoring and want that signal to drive on-call, incident workflow, and status pages without a separate paging product.
What it does
Pingdom posts check results to an Incido monitor URL configured for the Pingdom payload format. Incido tracks monitor health inside correlation groups, so a failing API synthetic can create an incident while Grafana or generic monitors for the same subsystem update that same record as more evidence arrives.
How to set it up
- 1
Create a Pingdom monitor in Incido
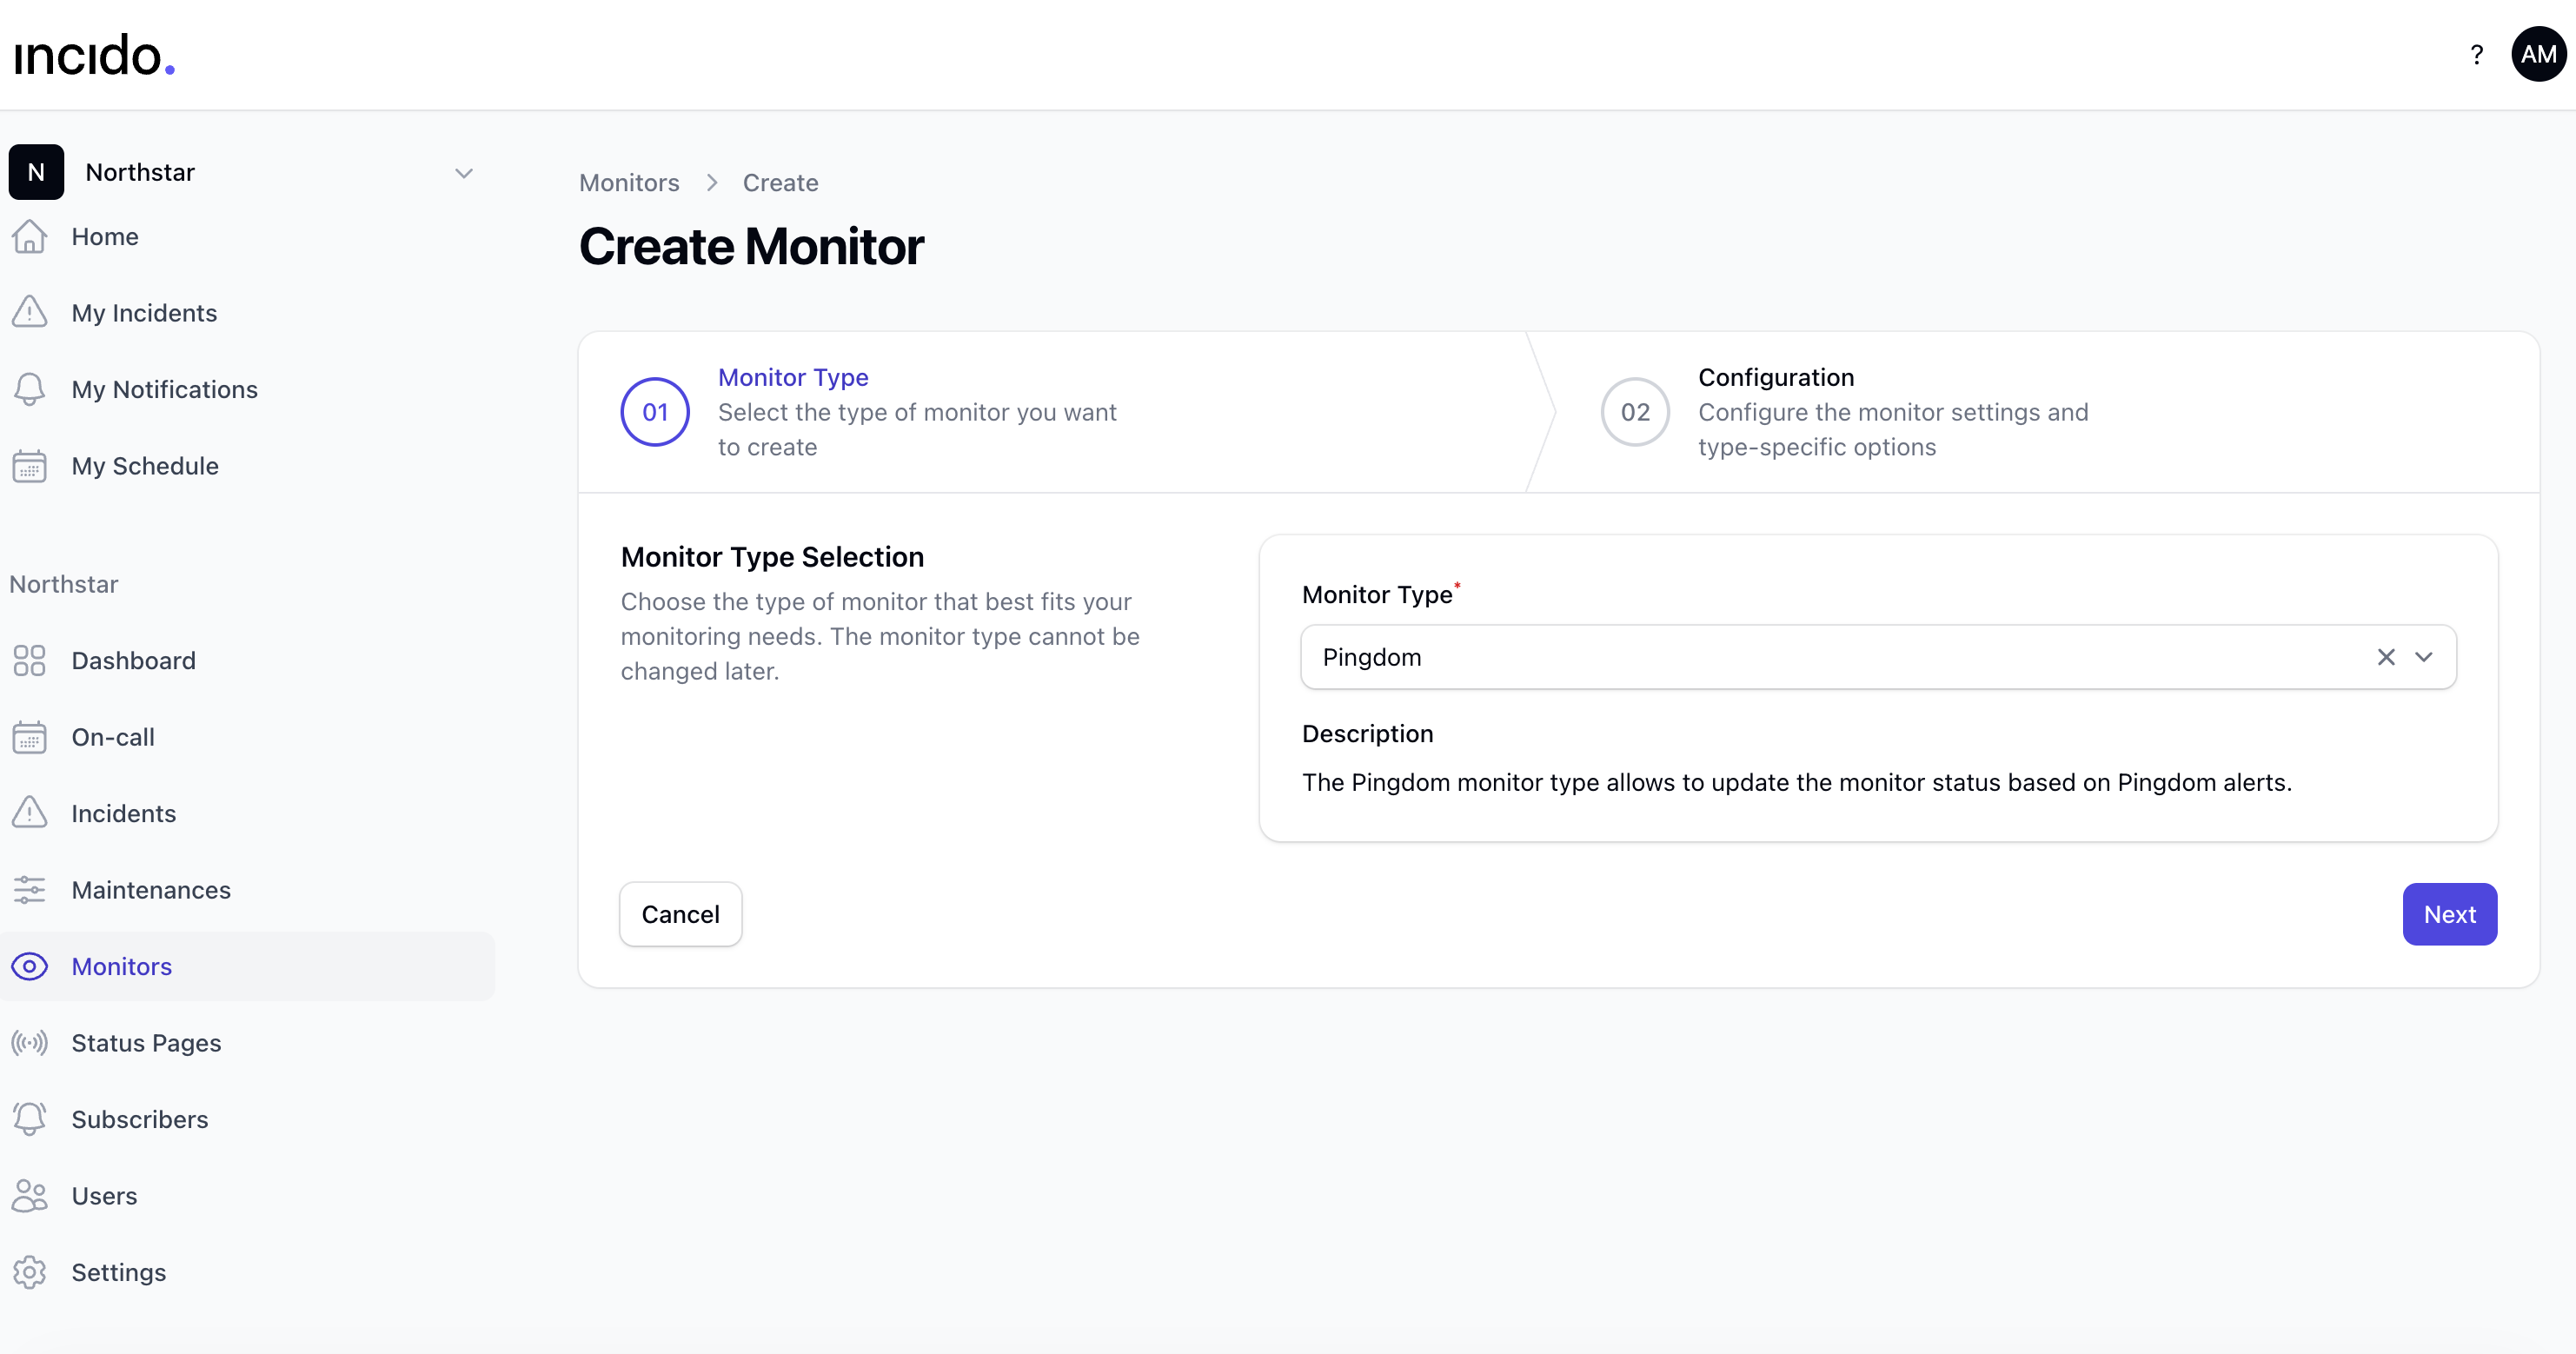
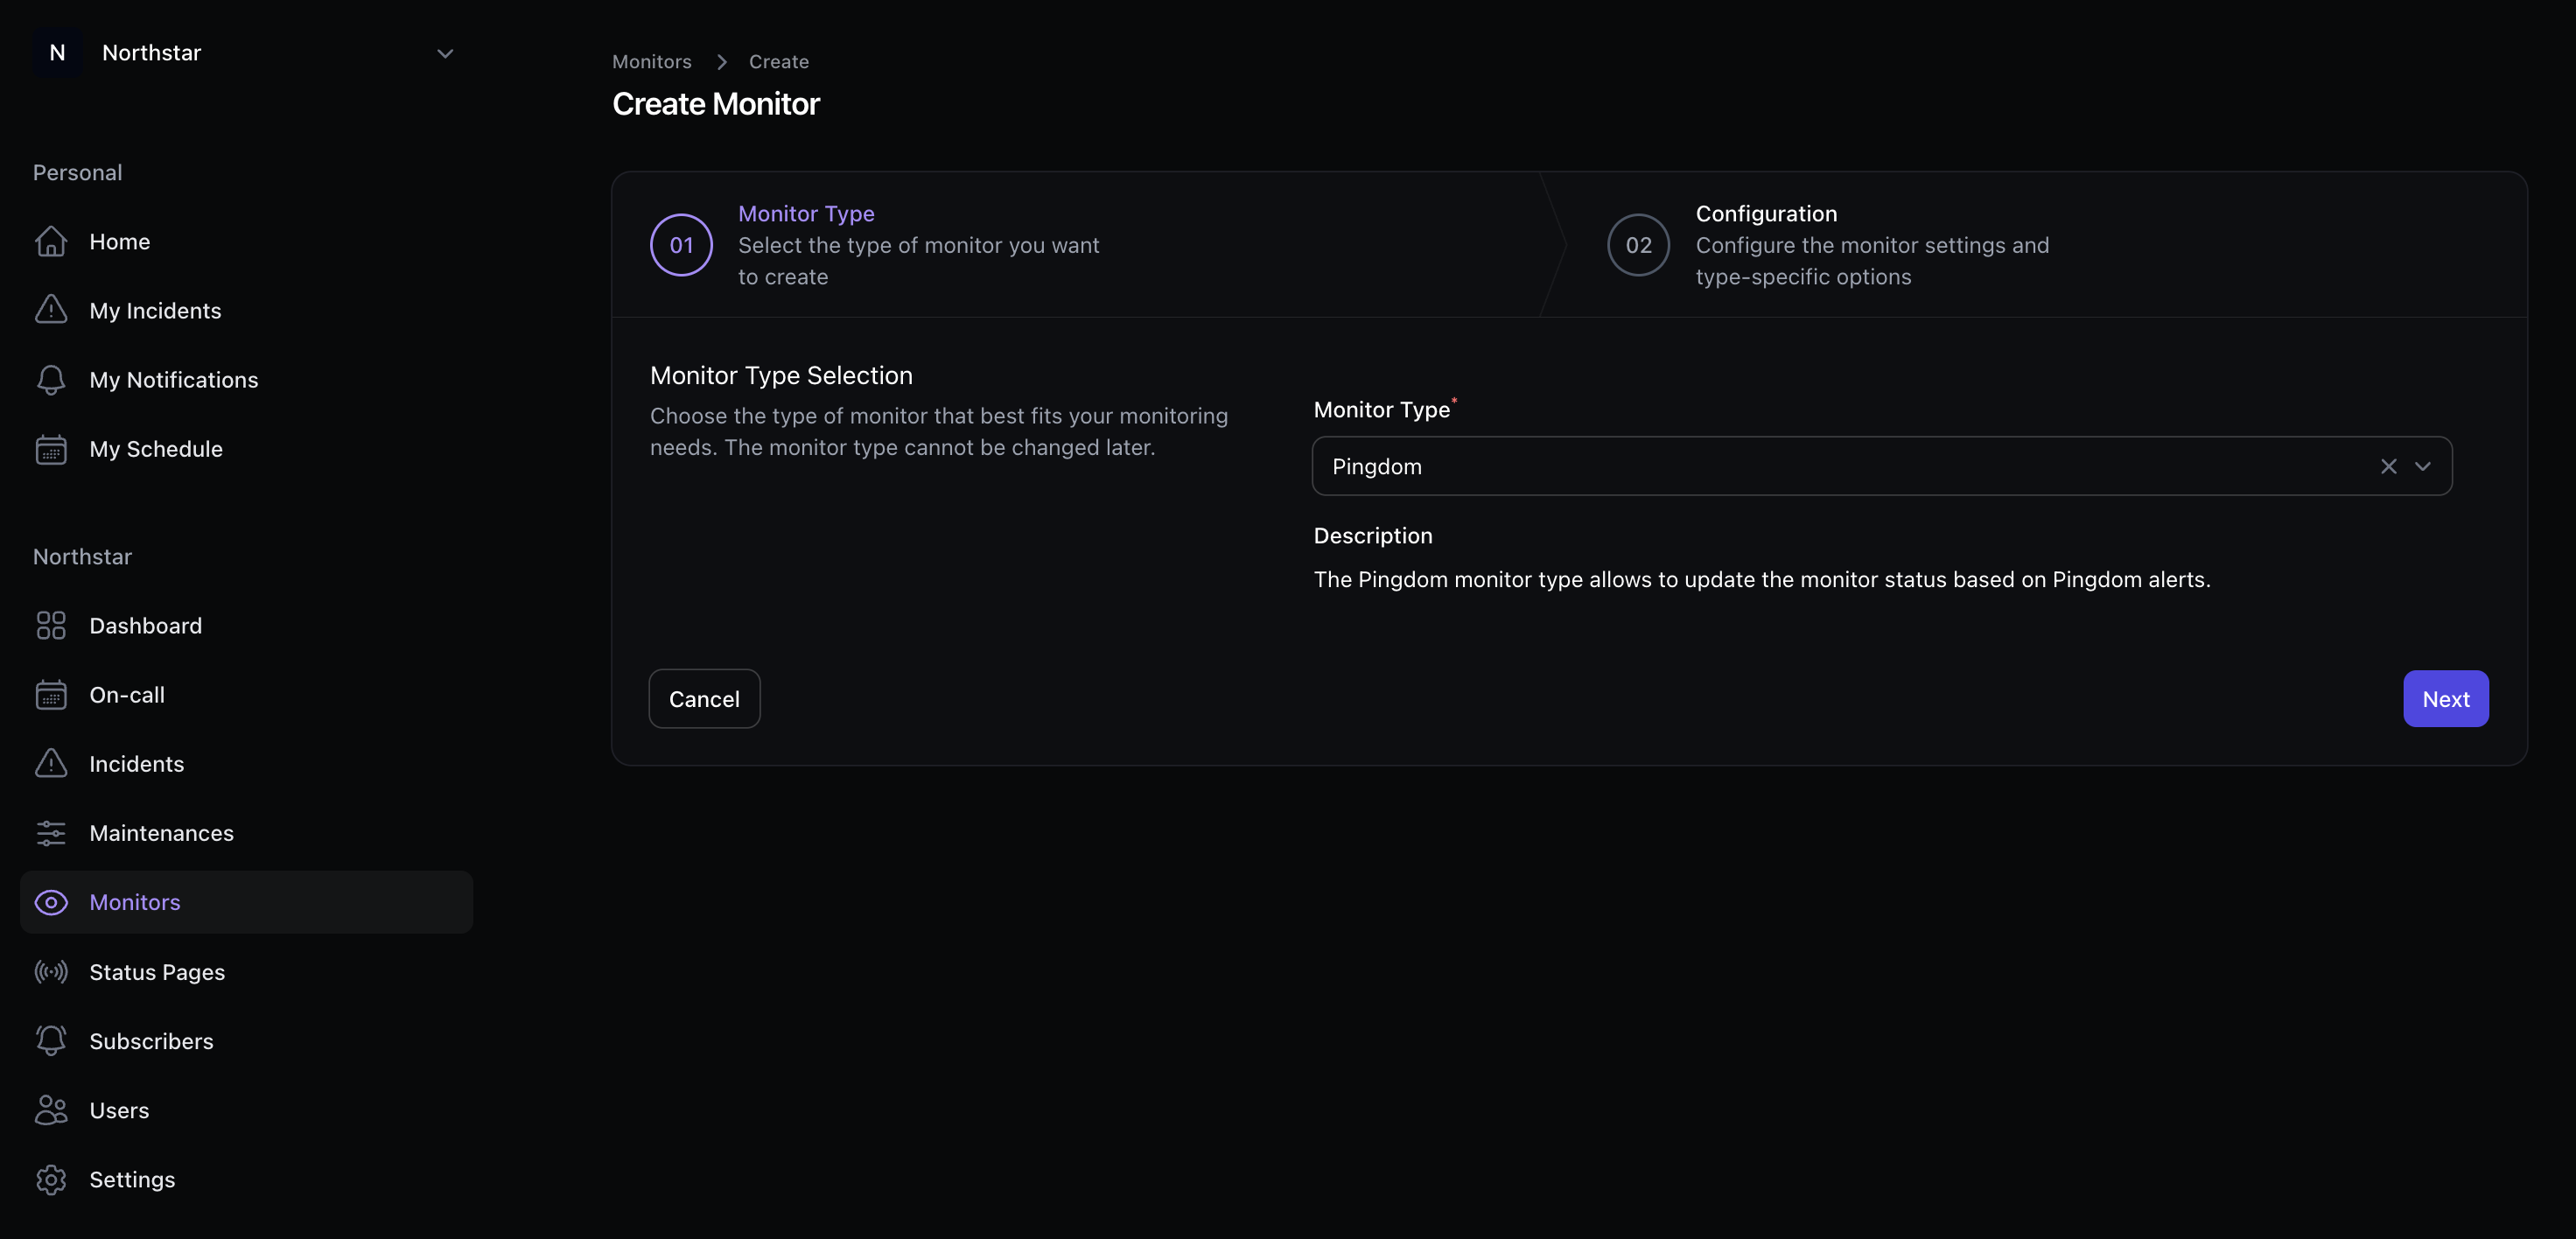
Add a monitor with type Pingdom in the Dashboard. Copy the webhook URL and map affected components plus default severity.
- 2
Configure Pingdom integrations
In Pingdom, open the check’s integration settings and add a webhook pointing at the Incido monitor URL. Confirm Pingdom sends notifications on DOWN and recovery if you rely on auto-resolution.
- 3
Group with related monitors
Add the Pingdom monitor to a correlation group alongside Grafana or generic monitors that describe the same product area. Tune trigger threshold (1 vs 2+ unhealthy) for your noise tolerance.
- 4
Verify paging and status publication
Trigger a test outage and confirm escalation policies page the right on-call engineer and status-page subscribers are notified when the incident becomes customer-visible.
Common use cases
- Public API health URL unreachable from the internet
- Transaction checks that validate login or checkout flows end-to-end
- First signal in a multi-monitor group before Grafana error-rate alerts fire
- Regional or edge synthetics merged into one platform-health incident
Incident Management in Incido
Pingdom posts check results to an Incido monitor URL configured for the Pingdom payload format. Incido tracks monitor health inside correlation groups, so a failing API synthetic can create an incident while Grafana or generic monitors for the same subsystem update that same record as more evidence arrives.