

Grafana Integration: Alert to Incident in Incido
Point Grafana notification channels at an Incido monitor URL so error-rate, latency, and SLO breaches open or enrich incidents without custom glue code.
Best when metrics already tell you something is wrong but you need one incident record, on-call paging, and status-page updates in the same workflow.
What it does
Grafana sends alert notifications to a dedicated Incido Grafana monitor webhook. Incido evaluates each payload, marks the monitor healthy or unhealthy, and, when the monitor belongs to a correlation group, creates or updates a single incident instead of opening duplicates for every alert firing. Pair Grafana with synthetic checks (Pingdom) or generic worker-health monitors in the same group when multiple signals describe one outage.
How to set it up
- 1
Create a Grafana monitor in Incido
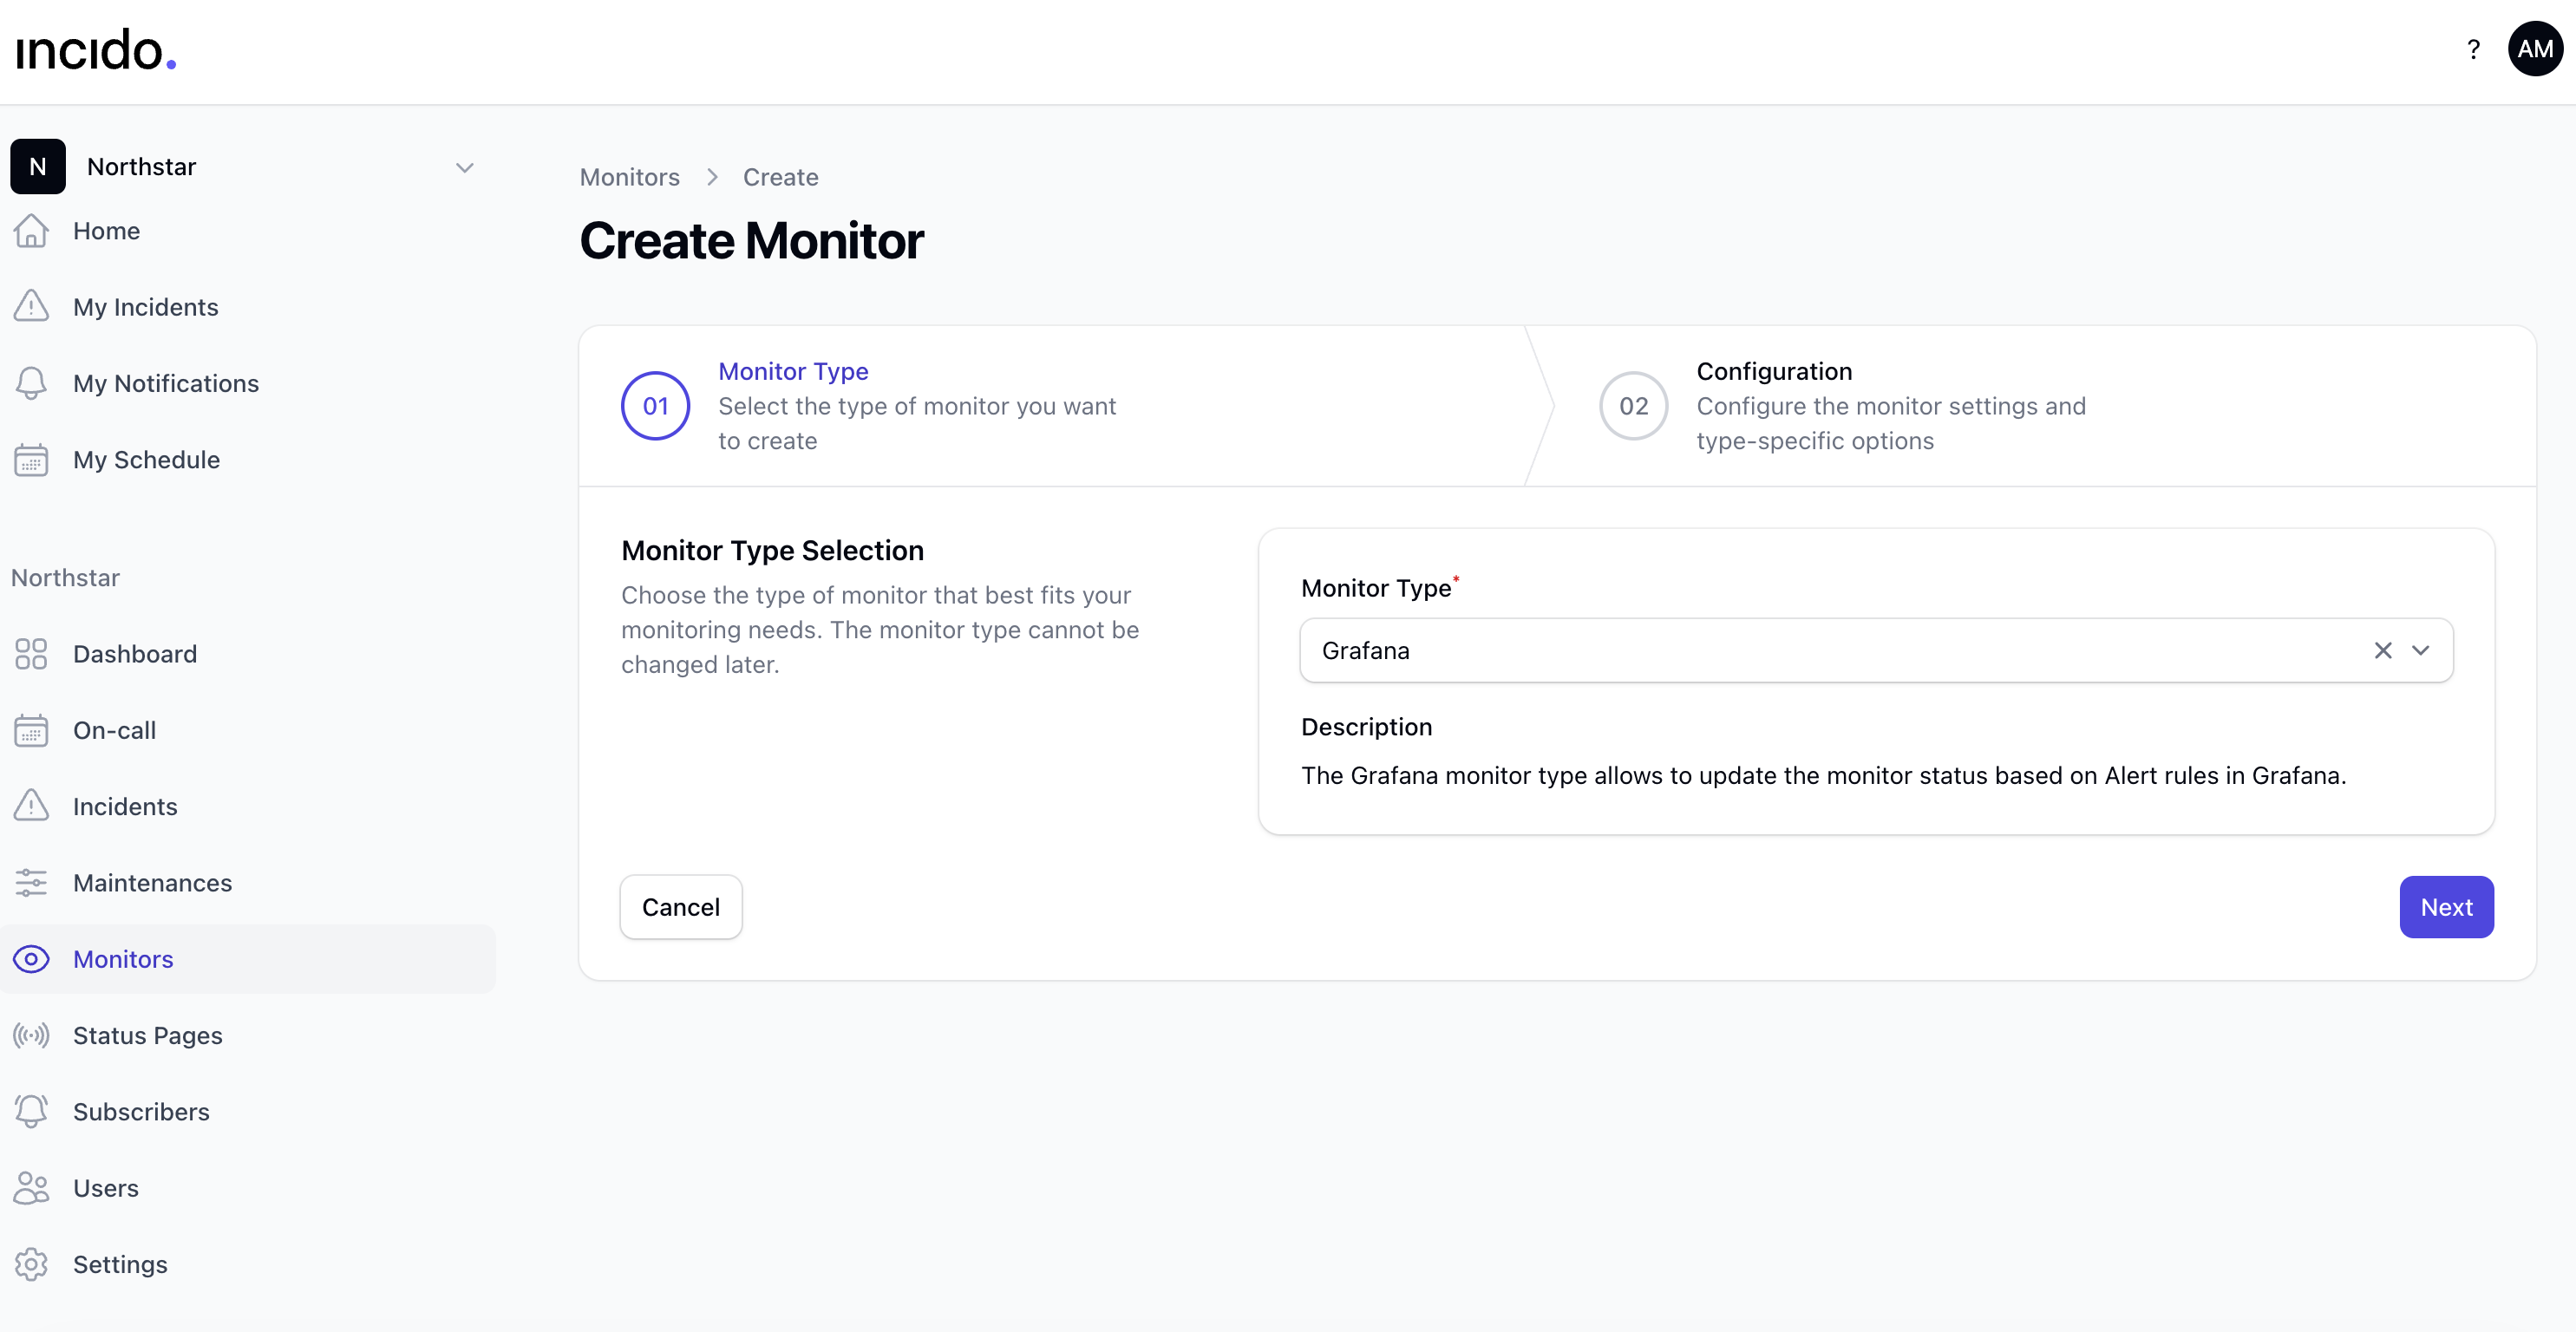
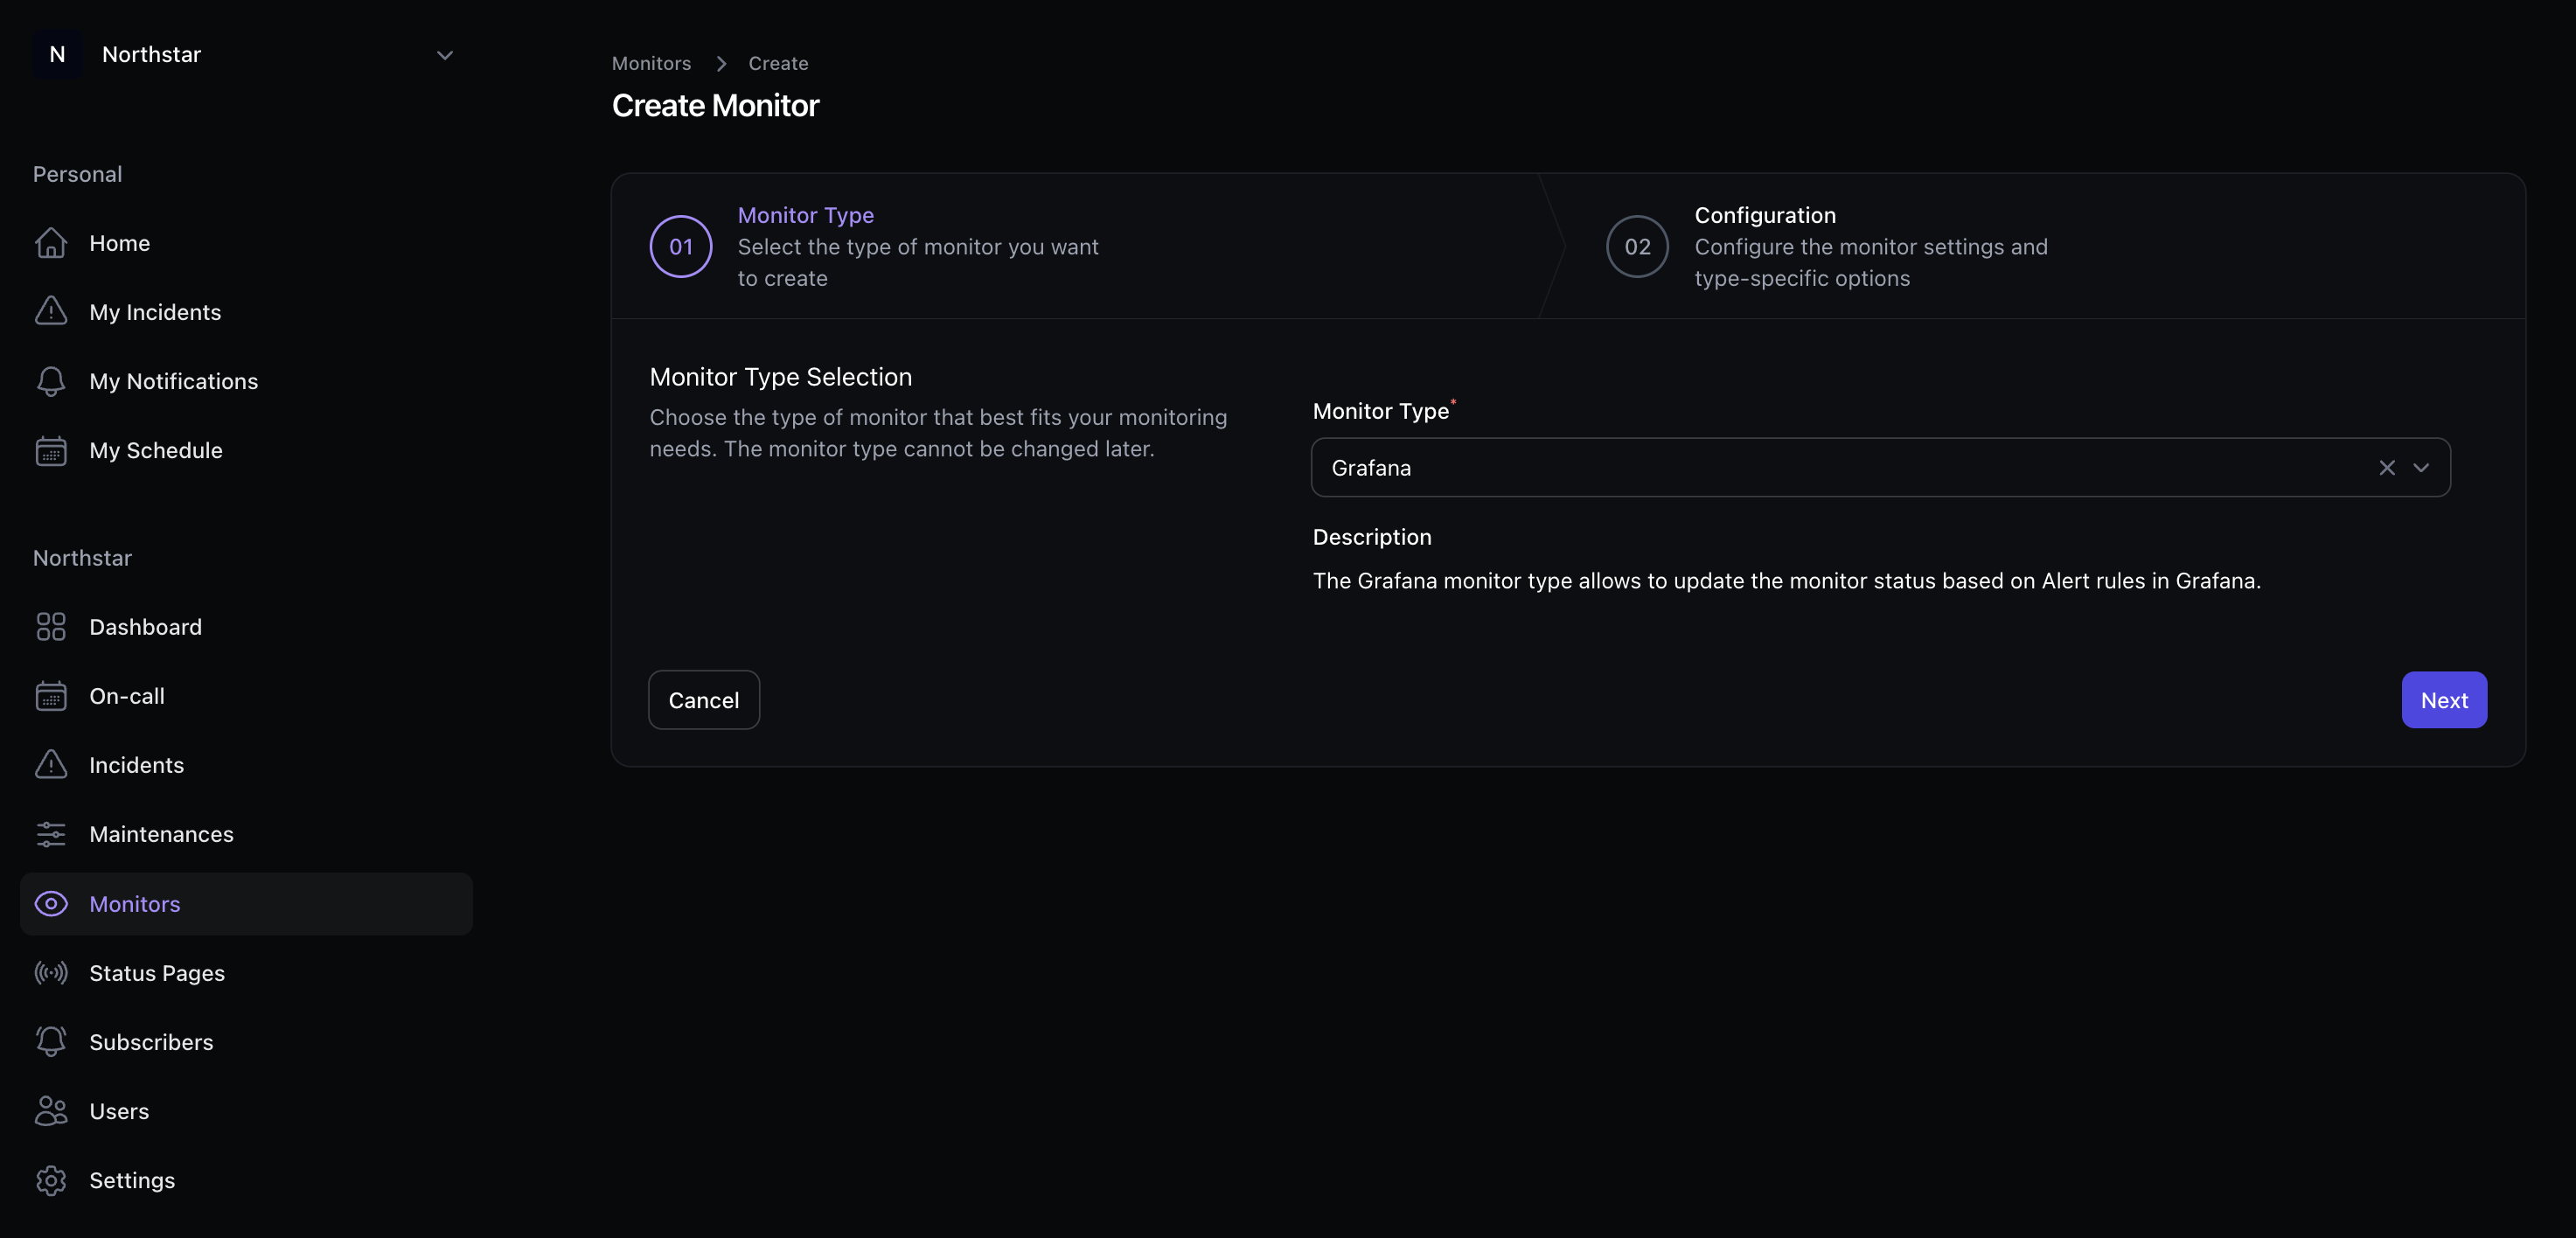
In the Dashboard, add a monitor with type Grafana and copy its unique webhook URL. Note which components and severity the monitor should apply when it triggers.
- 2
Add the URL to your Grafana contact point
In Grafana, create or edit a contact point (or legacy notification channel) and set the webhook URL to the Incido monitor endpoint. Use POST with the alert payload Grafana normally sends.
- 3
Attach the monitor to a correlation group
Place the Grafana monitor in a correlation group with related signals (API synthetics, queue health, etc.). Set trigger and resolution thresholds so Incido opens one incident per blast radius.
- 4
Test with a controlled alert
Fire a test alert from Grafana and confirm the monitor flips unhealthy, the incident lands in Triage or Active, and on-call notifications route through your escalation policy.
Common use cases
- Elevated 5xx rate on a customer-facing API while a tiny health probe still returns 200
- SLO or error-budget burn alerts that should page on-call and publish a status update
- Corroborating Grafana metrics with Pingdom synthetics in one incident timeline
- Automatic resolution when error rates recover and enough monitors in the group are healthy
Incident Management in Incido
Grafana sends alert notifications to a dedicated Incido Grafana monitor webhook. Incido evaluates each payload, marks the monitor healthy or unhealthy, and, when the monitor belongs to a correlation group, creates or updates a single incident instead of opening duplicates for every alert firing. Pair Grafana with synthetic checks (Pingdom) or generic worker-health monitors in the same group when multiple signals describe one outage.